JOURNAL / 2026.09.06
WeatherNext 3 brings satellite observations to hourly global forecasts
Google's new weather model incorporates recent satellite imagery, raises resolution, and publishes a global ensemble every hour; the evaluation is broad, but extreme rain, artifacts, and closed model access still set important limits.
A weather model can compute very quickly and still begin from an aging picture of the sky. Most global AI systems learn from analyses: regular reconstructions of the atmosphere that combine observations with a physics model. They are extraordinary scientific infrastructure, but take hours to produce and pass their biases into the model trained on them.
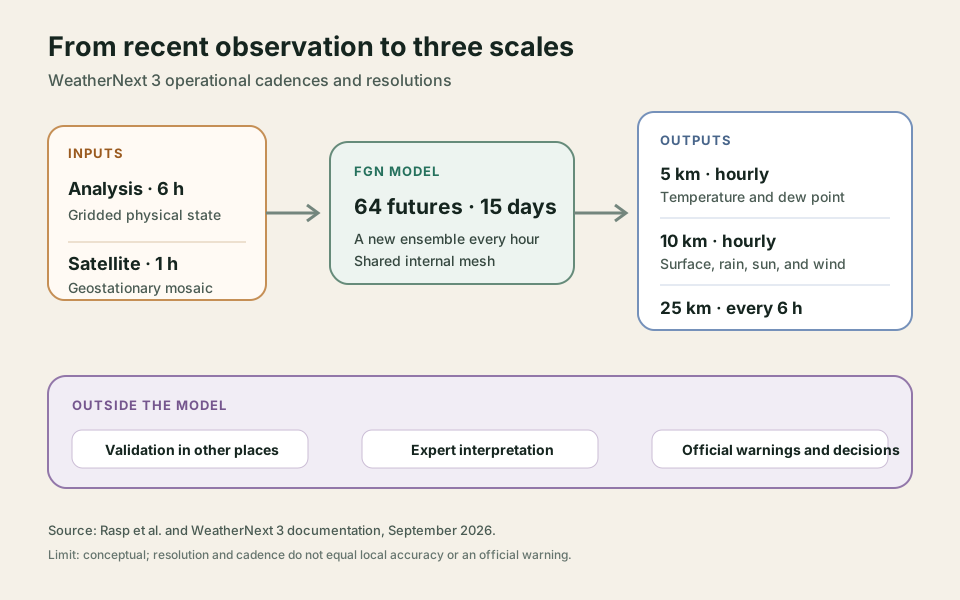
WeatherNext 3, introduced by Google DeepMind and Google Research on September 3, tries to close that gap. It retains two states from ECMWF's analysis but directly adds a sequence of geostationary satellite images whose newest observation is about an hour old. From those two sources, it generates a new 64-scenario global ensemble every hour and extends it to fifteen days. This is not merely a sharper WeatherNext 2: one network incorporates part of the data assimilation, forecasting, and local calibration that previously lived in separate stages.
The distinction from WeatherNext Cyclones, analyzed here in August, is material. That model added specific targets for cyclone track, intensity, and wind and Google released its weights. WeatherNext 3 retains that capability—with small but consistent improvements in track and intensity and larger gains in wind extent between one and three days—but its main advance spans the global atmosphere, precipitation, and station observations. Its weights have not been released.
The forecast stops imitating a single grid
The architecture described in the preprint does not force every kind of data onto the same resolution. Separate encoders carry 25-kilometer analysis and 10-kilometer satellite mosaics into a shared internal mesh. Several heads emerge from it: surface variables on a roughly 10-kilometer grid every hour; upper-atmosphere variables at roughly 25 kilometers and six hours; and station-calibrated temperature and dew point that can be queried at any coordinate and are published on a 5-kilometer grid.
That last result is not the same as simulating all physics at five kilometers. The station head learns from sparse measurements and metadata such as elevation and land or sea, then interpolates the internal representation. The team itself found strong biases in poorly observed areas including the Andes, Himalayas, and some high-latitude oceans. To reduce them, it added “pseudo-stations” whose values come from the physics-based analysis again. The network gains local detail, but does not leave numerical infrastructure behind or magically fill observational gaps.
The paper's evaluation is unusually broad for a launch. The model used for the 2024 tests saw only earlier data. It is compared with WeatherNext 2 and operational ECMWF ensembles across atmospheric fields, stations excluded from training, three different precipitation references, and cyclones worldwide. It improves on the references across most fields. A quasi-real-time test from July 1 to August 11, 2026 also puts it ahead of ECMWF's AI ensemble for much of the variable set, although six weeks is too short to represent a full year's seasons and extreme events.
For rain, the most useful headline is not the largest percentage. WeatherNext 3 learns three different products: ECMWF's analysis, NASA's IMERG, and PARDIG, an experimental Google reconstruction based on spaceborne radar. The improvement changes markedly with the chosen truth: it is largest against IMERG, smaller against US ground radar, and smaller again against rain gauges. Gains also concentrate near the rain/no-rain threshold; high rates have fewer cases and less stable metrics. No single figure means “50% better rain forecasts” for every place, intensity, and lead time.
The hourly refresh does have an isolated effect. When the comparison is adjusted for the time a forecast is actually available, intermediate initializations provide an average two-to-three-hour lead-time gain for short-range precipitation. That is consistent with receiving new observations three hours earlier on average than in a six-hour cycle. It can matter for a fast-evolving system, but “forecast every hour” describes initialization frequency, not fifteen independent predictions or a six-hour improvement in every case.
More operational does not mean more authoritative
Google is already distributing WeatherNext 3 through Search, Maps, and Gemini, and lets users request its data through Cloud Storage, Earth Engine, and BigQuery. The full Cloud Storage archive contains all 64 members; the other surfaces offer ready-to-query means and percentiles. Access requires a Google account and allowlisting, advertised as taking five to seven business days. Data becomes CC BY 4.0 once it is at least one hour old; real-time and future data has separate experimental terms.
This is practical availability, not model openness. Google has published the paper, variables, notebooks, and forecasts, but not WeatherNext 3's training code or weights. An outside team can evaluate historical output and build on it; it cannot run the network independently, inspect the checkpoint, or reconstruct the chain that turns satellites and analyses into an ensemble. That difference matters both for continuity of a critical service and for scientific reproducibility.
Google supports its leadership claim with Brightband's Operational WeatherBench, an independent evaluation that continuously scores physics and AI models. Its methodology strengthens the comparison by using operational cycles and common rules, but also bounds the headline: it verifies upper-level fields at 25 kilometers and WeatherNext 3's surface at 10 kilometers against ECMWF's analysis. It currently omits the model's precipitation because that output predicts a satellite-based target at another resolution, making a direct comparison unfair to one objective or the other. The independent dashboard supports skill on common fields; it does not reproduce the paper's rain figures.
Google's paper also shows defects that an average can hide. Individual members sometimes produce hexagonal mesh patterns, especially in rain, and the station head can jump at internal six-hour boundaries. Each member also tends toward a global warm or cold bias that changes in the next block. The ensemble median and quantiles suppress much of this artifact, so aggregated probabilities remain useful; extracting one member as though it were a physically continuous future is riskier.
My reading is that the deeper change is not AI “replacing physics,” but a learned global forecast beginning to listen to recent, heterogeneous observations without waiting for all of them to traverse the traditional pipeline. That shortens the cycle and makes it possible to build local or energy products on a refreshed distribution. It also shifts responsibility toward the data user: they need to know which head they are using, which observation trained it, whether they need a probability or a member, and what happens when satellites or stations are missing.
The WeatherNext terms explicitly say the system is experimental and does not constitute an official weather warning. That is the right boundary. A statistical improvement can enrich a decision by an agency, grid operator, or farmer; it does not by itself show that a better warning will be issued or that an intervention will prevent harm. WeatherNext 3 materially narrows the distance between observation and forecast. The distance between forecast and responsible decision still belongs to the human system that validates and acts on it.
Sources
- Google, Introducing WeatherNext 3, our most advanced and accurate global weather AI model, September 3, 2026.
- Rasp et al., WeatherNext 3: Increasing resolution and performance of global weather models with raw observations, preprint, September 3, 2026.
- Google for Developers, WeatherNext 3 model specification and variables and forecast access guide, accessed September 6, 2026.
- Brightband, Operational WeatherBench methodology, accessed September 6, 2026.
- Google for Developers, WeatherNext terms of service and disclaimers, accessed September 6, 2026.